RI Marketplace H1 2026: Traded Volume Grows as Buyer Demand Continues to Expand
RI Marketplace traded $401.9M across 193 assets in H1 2026, up 11.4% year over year, as buyer demand and investor engagement continued to grow and transaction activity broadened across office, hospitality, multifamily and other CRE sectors.
Traded Volume Grows as Buyer Demand Expands
RI Marketplace entered 2026 with continued momentum across transaction volume, buyer activity, and asset diversity. Through the first half of the year, the platform successfully traded193 assets totaling $401.9 million, an 11.4% increase in volume compared with H1 2025.
The growth came as the market continues to navigate increasing cost of capital with the ten-year treasury yield hovering around annual highs and inflating cap rates across the commercial real estate sector. In this environment, sellers are looking for more structured ways to establish pricing, reach qualified buyers, and move assets toward close with certainty.
Market Share Reflects More Than Volume
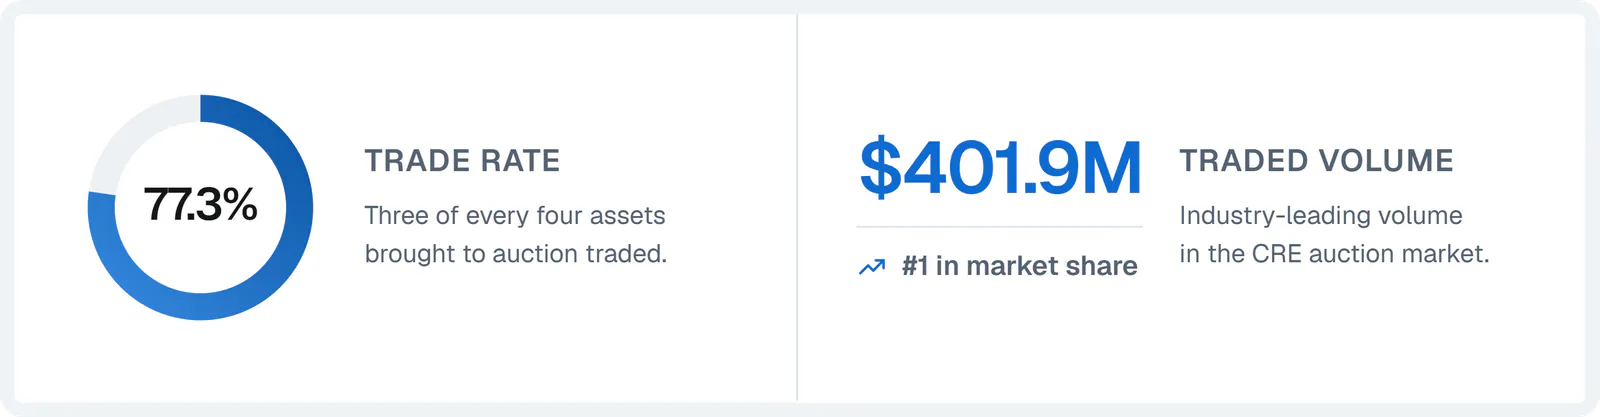
RI Marketplace's H1 transaction growth has also propelled them into a leading position within the CRE auction market with its industry-leading traded volume, $401.9 million, and a 77.3% trade rate through June 2026.
Marketplace’s efficiency (77% trade rate) is critical to its growth story. Fostering a trust relationship with investors who underwrite and bid confidently knowing assets and sellers on the platform have been diligence and have a high likelihood of trade. This reflects a more disciplined process: rigorous underwriting to ensure market-aligned expectations, and targeted marketing designed to reach the right buyers.
Transaction Growth Broadened Across Property Types
Hospitality remained the largest category by total volume, followed closely by office and multifamily. Together, those three sectors accounted for approximately 70% of traded volume during the first half of the year.
The largest year-over-year gains came from sectors that had been comparatively smaller contributors one year earlier. Office volume increased 180%; senior housing increased 143%, and multifamily doubled. Retail and hospitality volume remained significant contributors to overall platform activity.
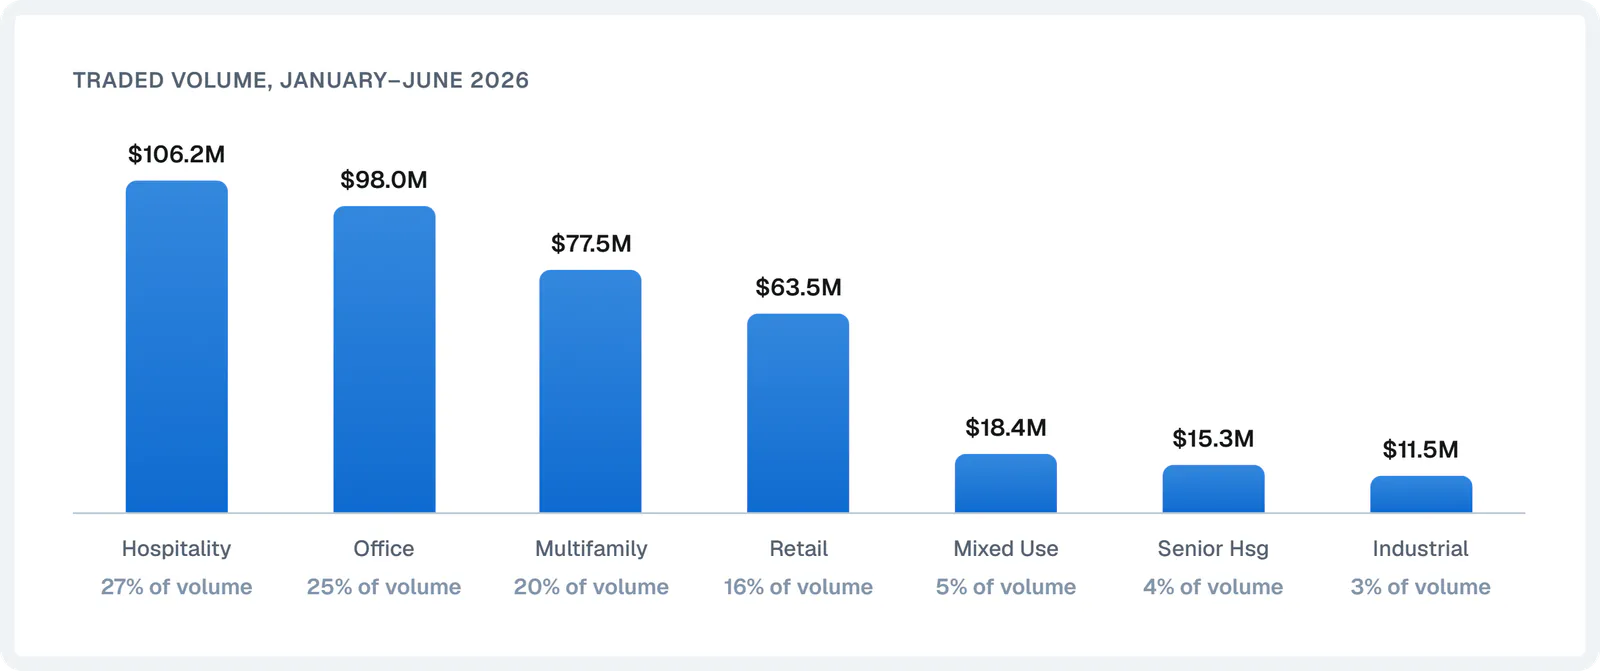
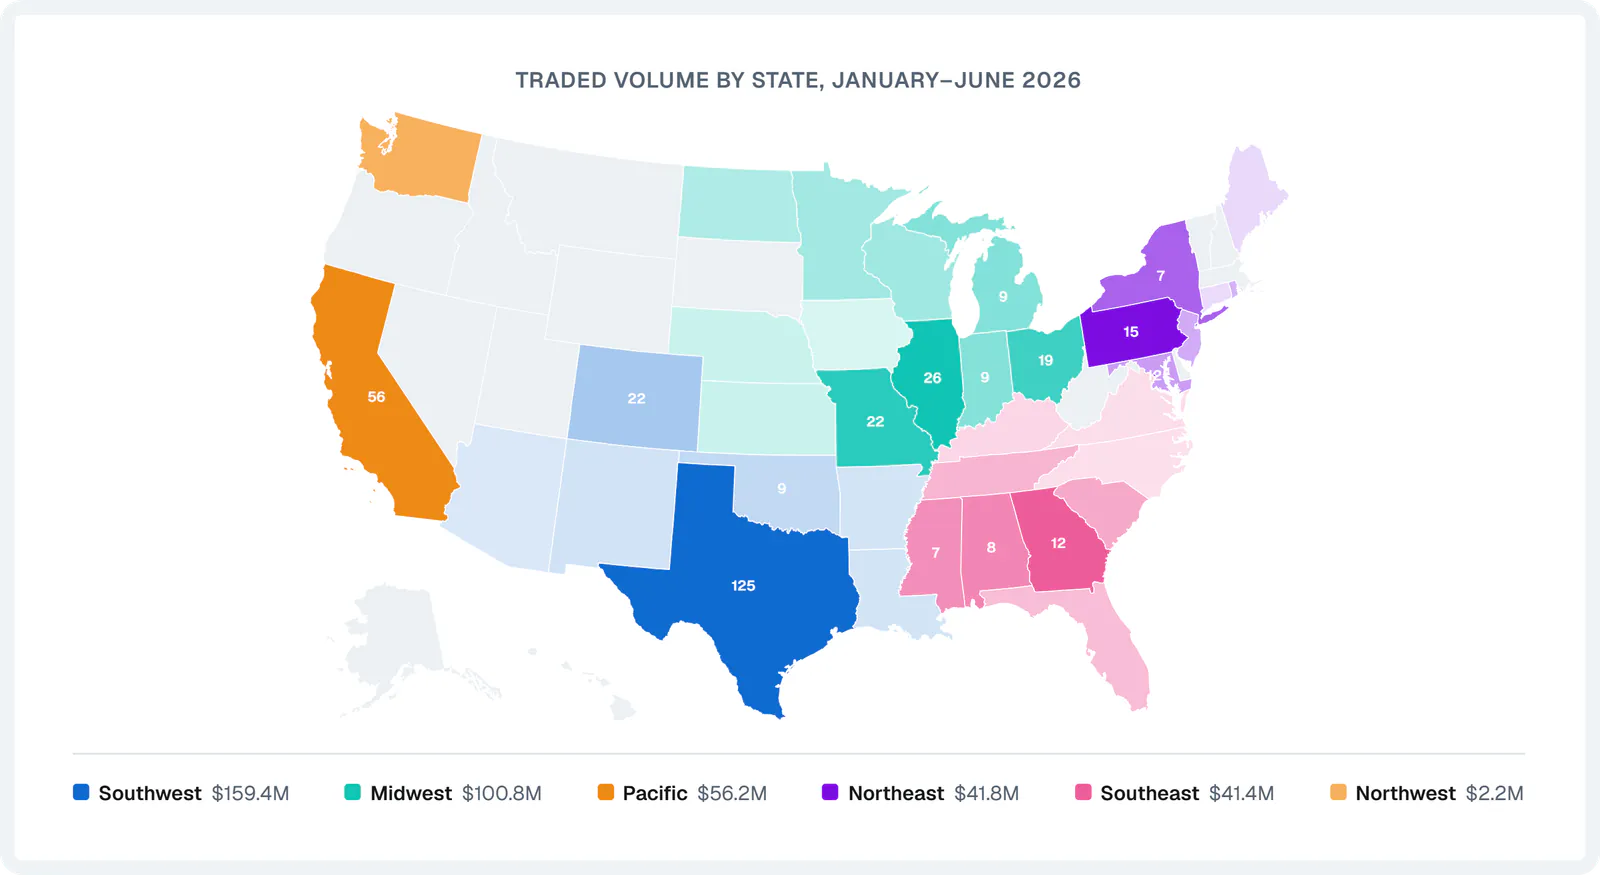
In a market where liquidity can vary significantly by product type, growth across office, multifamily, senior housing and industrial shows that structured price discovery is playing a larger role across CRE asset classes.
Buyer Demand Continued to Expand
Buyer engagement strengthened alongside transaction volume. Through a newly enhanced, targeted marketing approach, RI Marketplace saw unique viewers per asset increase 13%, signed confidentiality agreements increase 14%, and bid registrations increase 10% year over year. The investor network expanded as well, with new user registrations up 47.6% year over year and new investor registrations up nearly 50%.
The continued expansion of the investor network gives each new asset access to a larger audience, while targeted marketing, broker outreach and buyer qualification help narrow that audience toward investors with the ability and intent to transact.
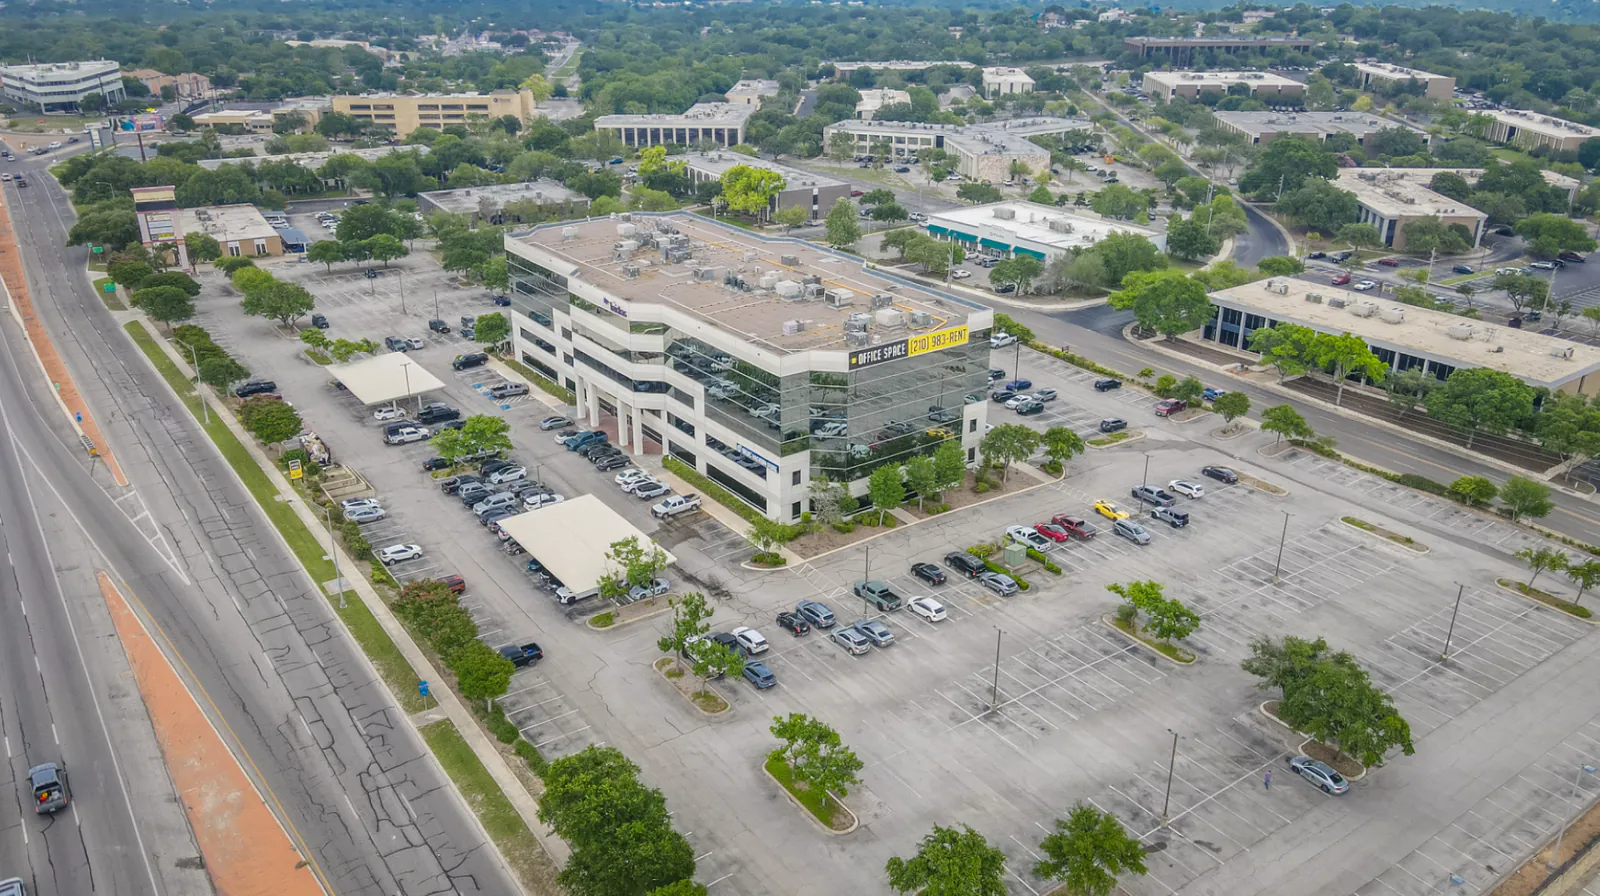
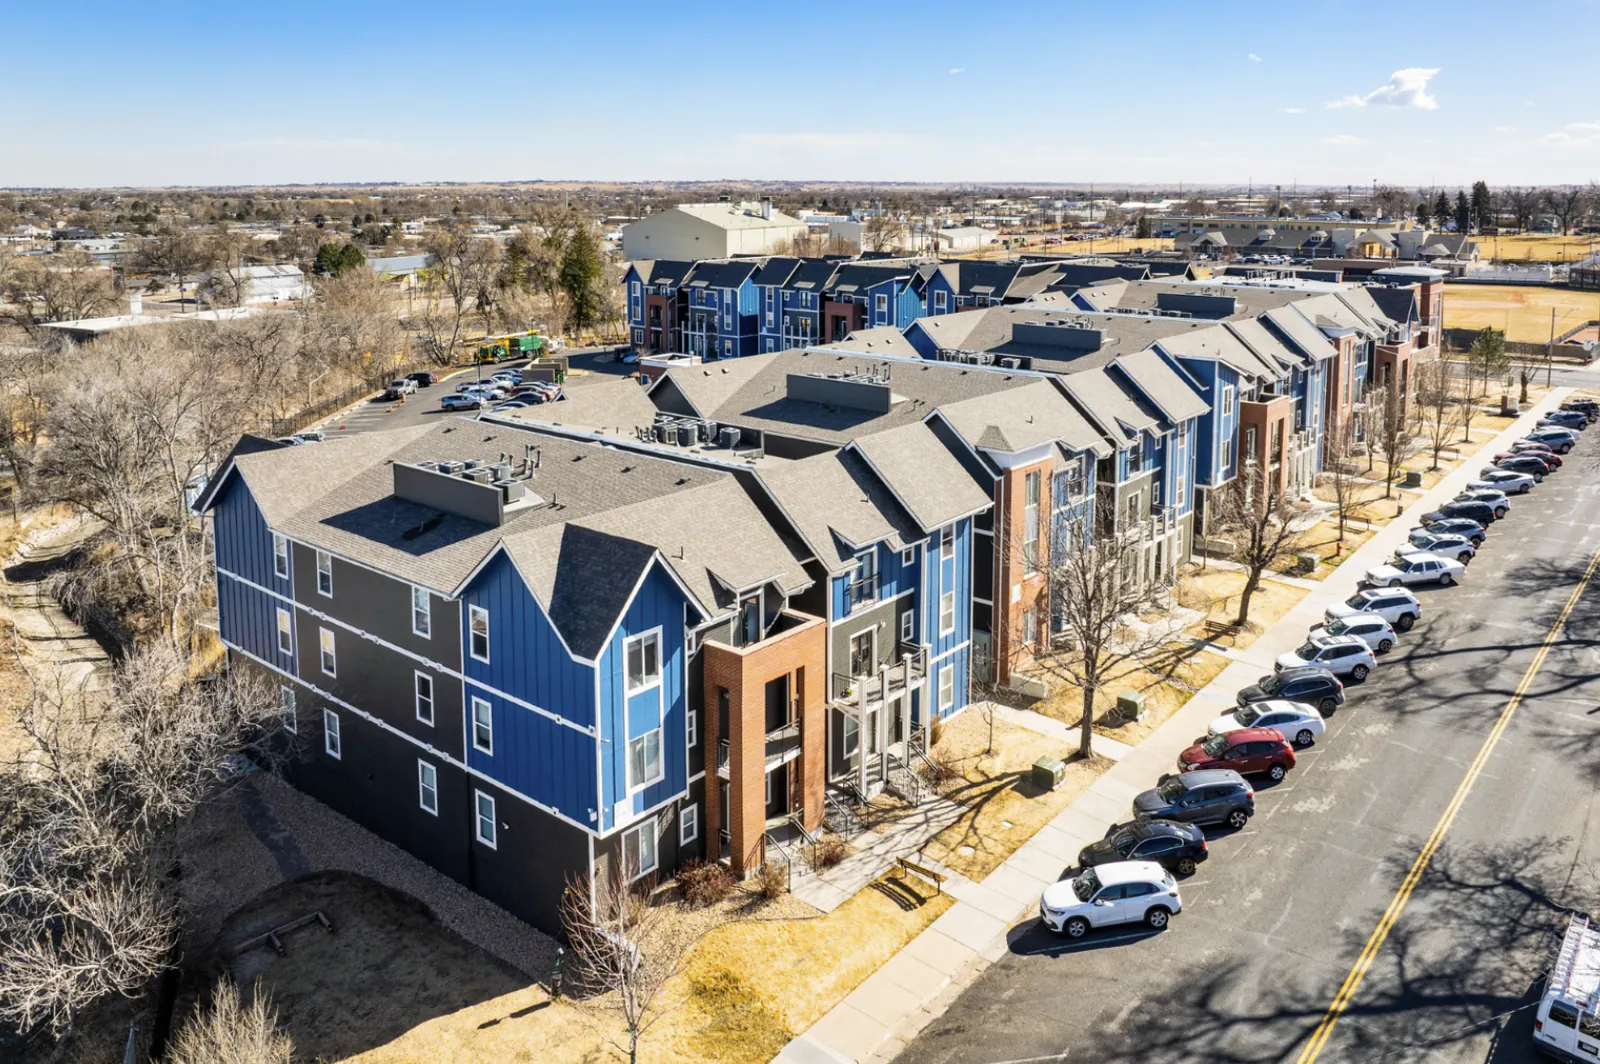
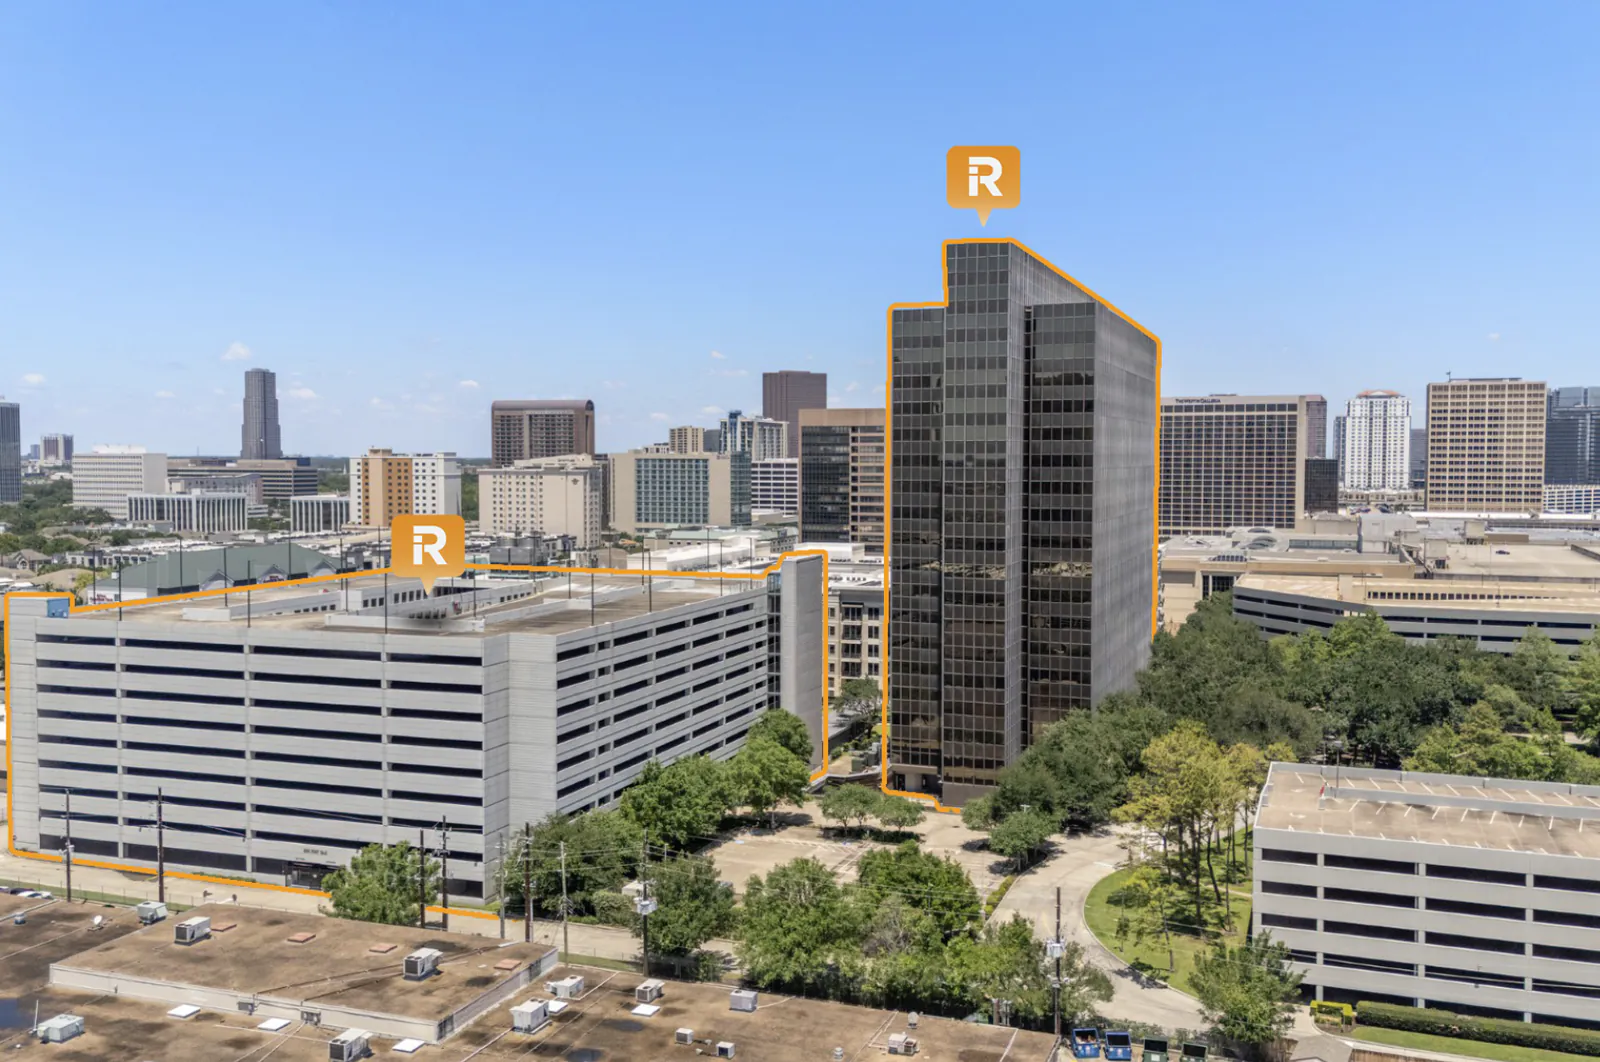
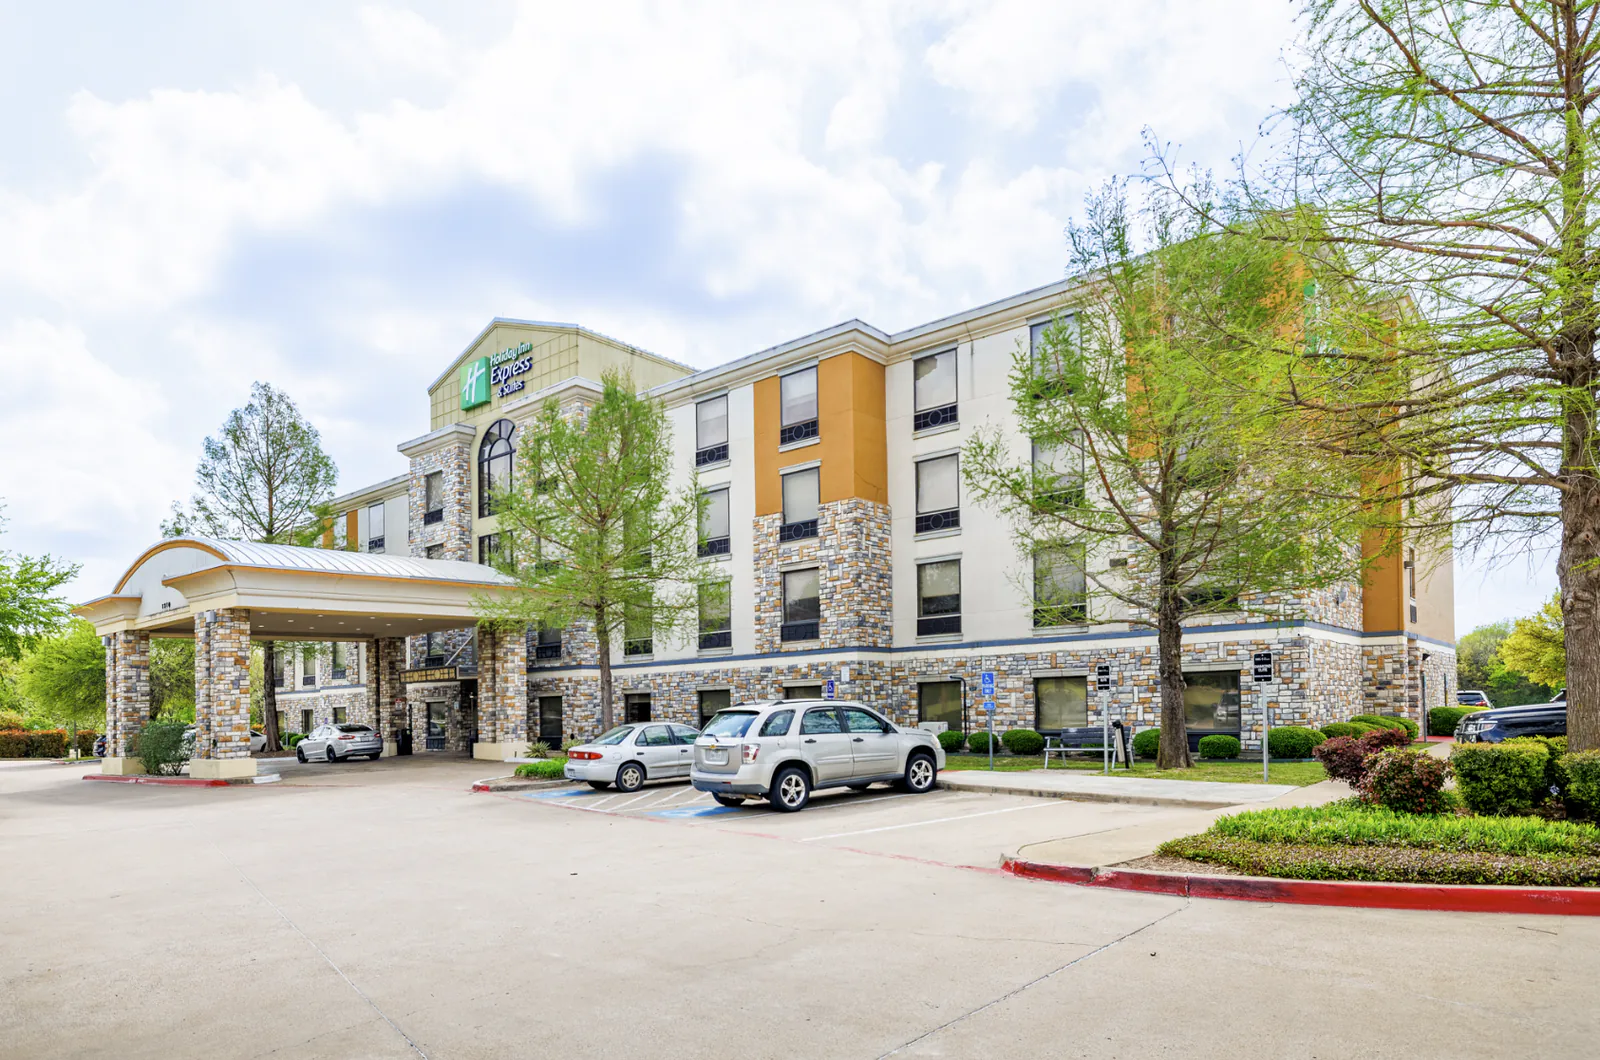
Featured Transactions Behind the Numbers
A Larger Market, With More Visibility Into Demand
The first half of 2026 reflects continued growth in client and consumer metrics for RI Marketplace: more transaction volume moving through the platform and a larger investor audience engaging with those opportunities.
For sellers and brokers, that creates a more measurable view of the market. Buyer activity can be tracked from initial exposure through diligence, qualification and bidding, while a defined auction timeline creates a clear point for the market to establish value.
As the commercial real estate market continues to evolve in the second half of the year, RI Marketplace remains focused on combining broad buyer reach, targeted marketing and disciplined transaction execution to move assets from market launch to funded close.
H1 performance data reflects RI Marketplace activity from January 1 through June 30, 2026.